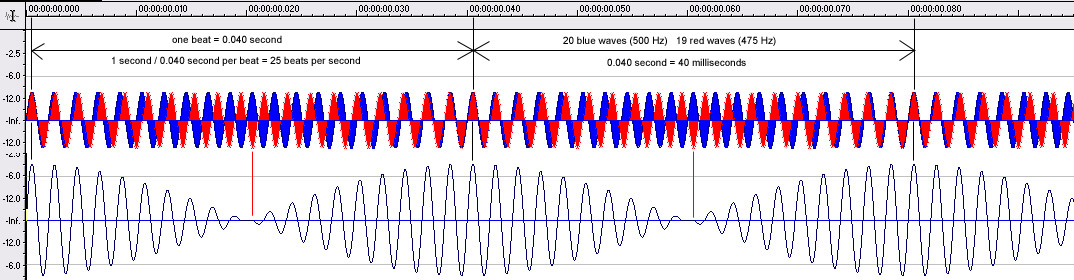
Beating Patterns in Wave TracesJeff La FavreJeffrey La Favre - jlafavre@gmail.com The illustration below is helpful in understanding the cause of beating. For demonstration purposes, a 475 Hz tone was mixed with a 500 Hz tone using computer software. In the upper wave trace, the wave pattern of the 475 Hz tone (red) is overlaid on the 500 Hz tone (blue), as they would appear if not mixed together. Along the upper trace there are three locations where the waves of the two tones are in phase. That is, the positive peak of one tone lines up with the positive peak of the other tone. These locations are marked with black vertical lines. When the tones are mixed together, they produce a wave trace like the one at the bottom of the illustration. Note that this complex tone has a periodic fluctuation in the wave amplitude (amplitude modulation). This periodic fluctuation is known as beating. The bottom wave trace can be understood by comparing it to the upper trace. Find the two locations on the bottom trace marked with red vertical lines. At these points there is no amplitude (height) in the wave trace. Look at the same points on the upper trace. At these points there is a positive blue peak for the 500 Hz tone and a negative red peak for the 475 Hz tone. The amplitude values for both tones at these points are the same, except the 500 Hz tone is positive and the 475 Hz tone is negative. When mixed together, the positive and negative peaks result in a peak with 0 amplitude (i.e., no peak at all). In contrast, at the points marked with the black vertical lines, the waves for the 500 Hz tone are lined up with the waves for the 475 Hz tone. At these points the waves of the two tones are said to be in phase. Since the peak amplitudes for both tones are positive, when mixed together, they result in waves with an amplitude two times the height of each individual tone wave. |
|
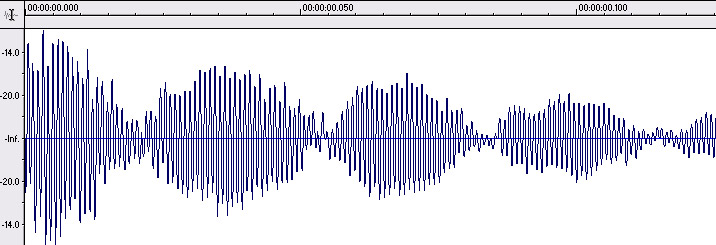
Listen to a complex tone of 475 Hz mixed with 500 Hz First 120 milliseconds of vibration in La Favre marimba bar A2
The wave trace above demonstrates a specific pattern resulting from the mixture of two frequencies that are closely spaced in the spectrum. This is the classic beating pattern in the wave trace. However, there is another similar pattern seen in wave traces that is not due to a beating problem. The two wave traces provided below should be helpful in distinguishing the two pattern types.
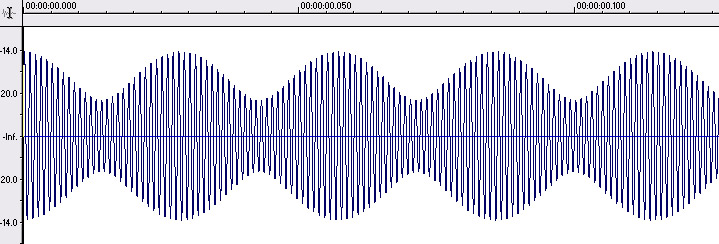
Wave trace for a mixture of a 965 Hz tone with a 1000 Hz tone. Here we see the classic wave pattern for two closely spaced frequencies that result in beating. A careful examination of the wave trace reveals that there is a cyclic variation in the wave amplitude (height of the waves).
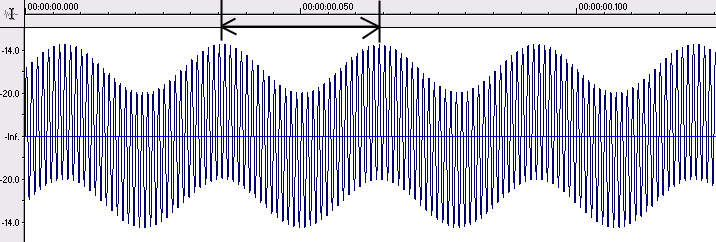
Wave trace for a mixture of a 35 Hz tone with a 1000 Hz tone. While this wave trace may appear to be similar to the wave trace above it, this trace is the result of a mixture of widely spaced frequencies in the spectrum. A careful examination of this wave pattern reveals that there is actually no variation in wave amplitude (wave height) unlike the trace above it. Here the 1000 Hz waves move up and down in a pattern that matches the wave pattern of the 35 Hz tone (one wave length of the 35 Hz tone is marked by vertical lines in the image above). The fundamental and tenth harmonic overtone mixture of a bar produces a wave trace that looks like this trace. It is important not to confuse this wave pattern with a pattern resulting from a beating mixture of frequencies. RETURN TO LATERAL AND TORSIONAL MODE TUNING PAGE Last update 3/12/07 © 2007 Jeffrey La Favre |